Launchpads: revenue resilience and token valuations
Pons and StonkFun out-earned Pump in September, then lost over 90% of their revenue. Why both became more expensive relative to revenue while PUMP got cheaper.
Research snapshot · 21 Oct 2026
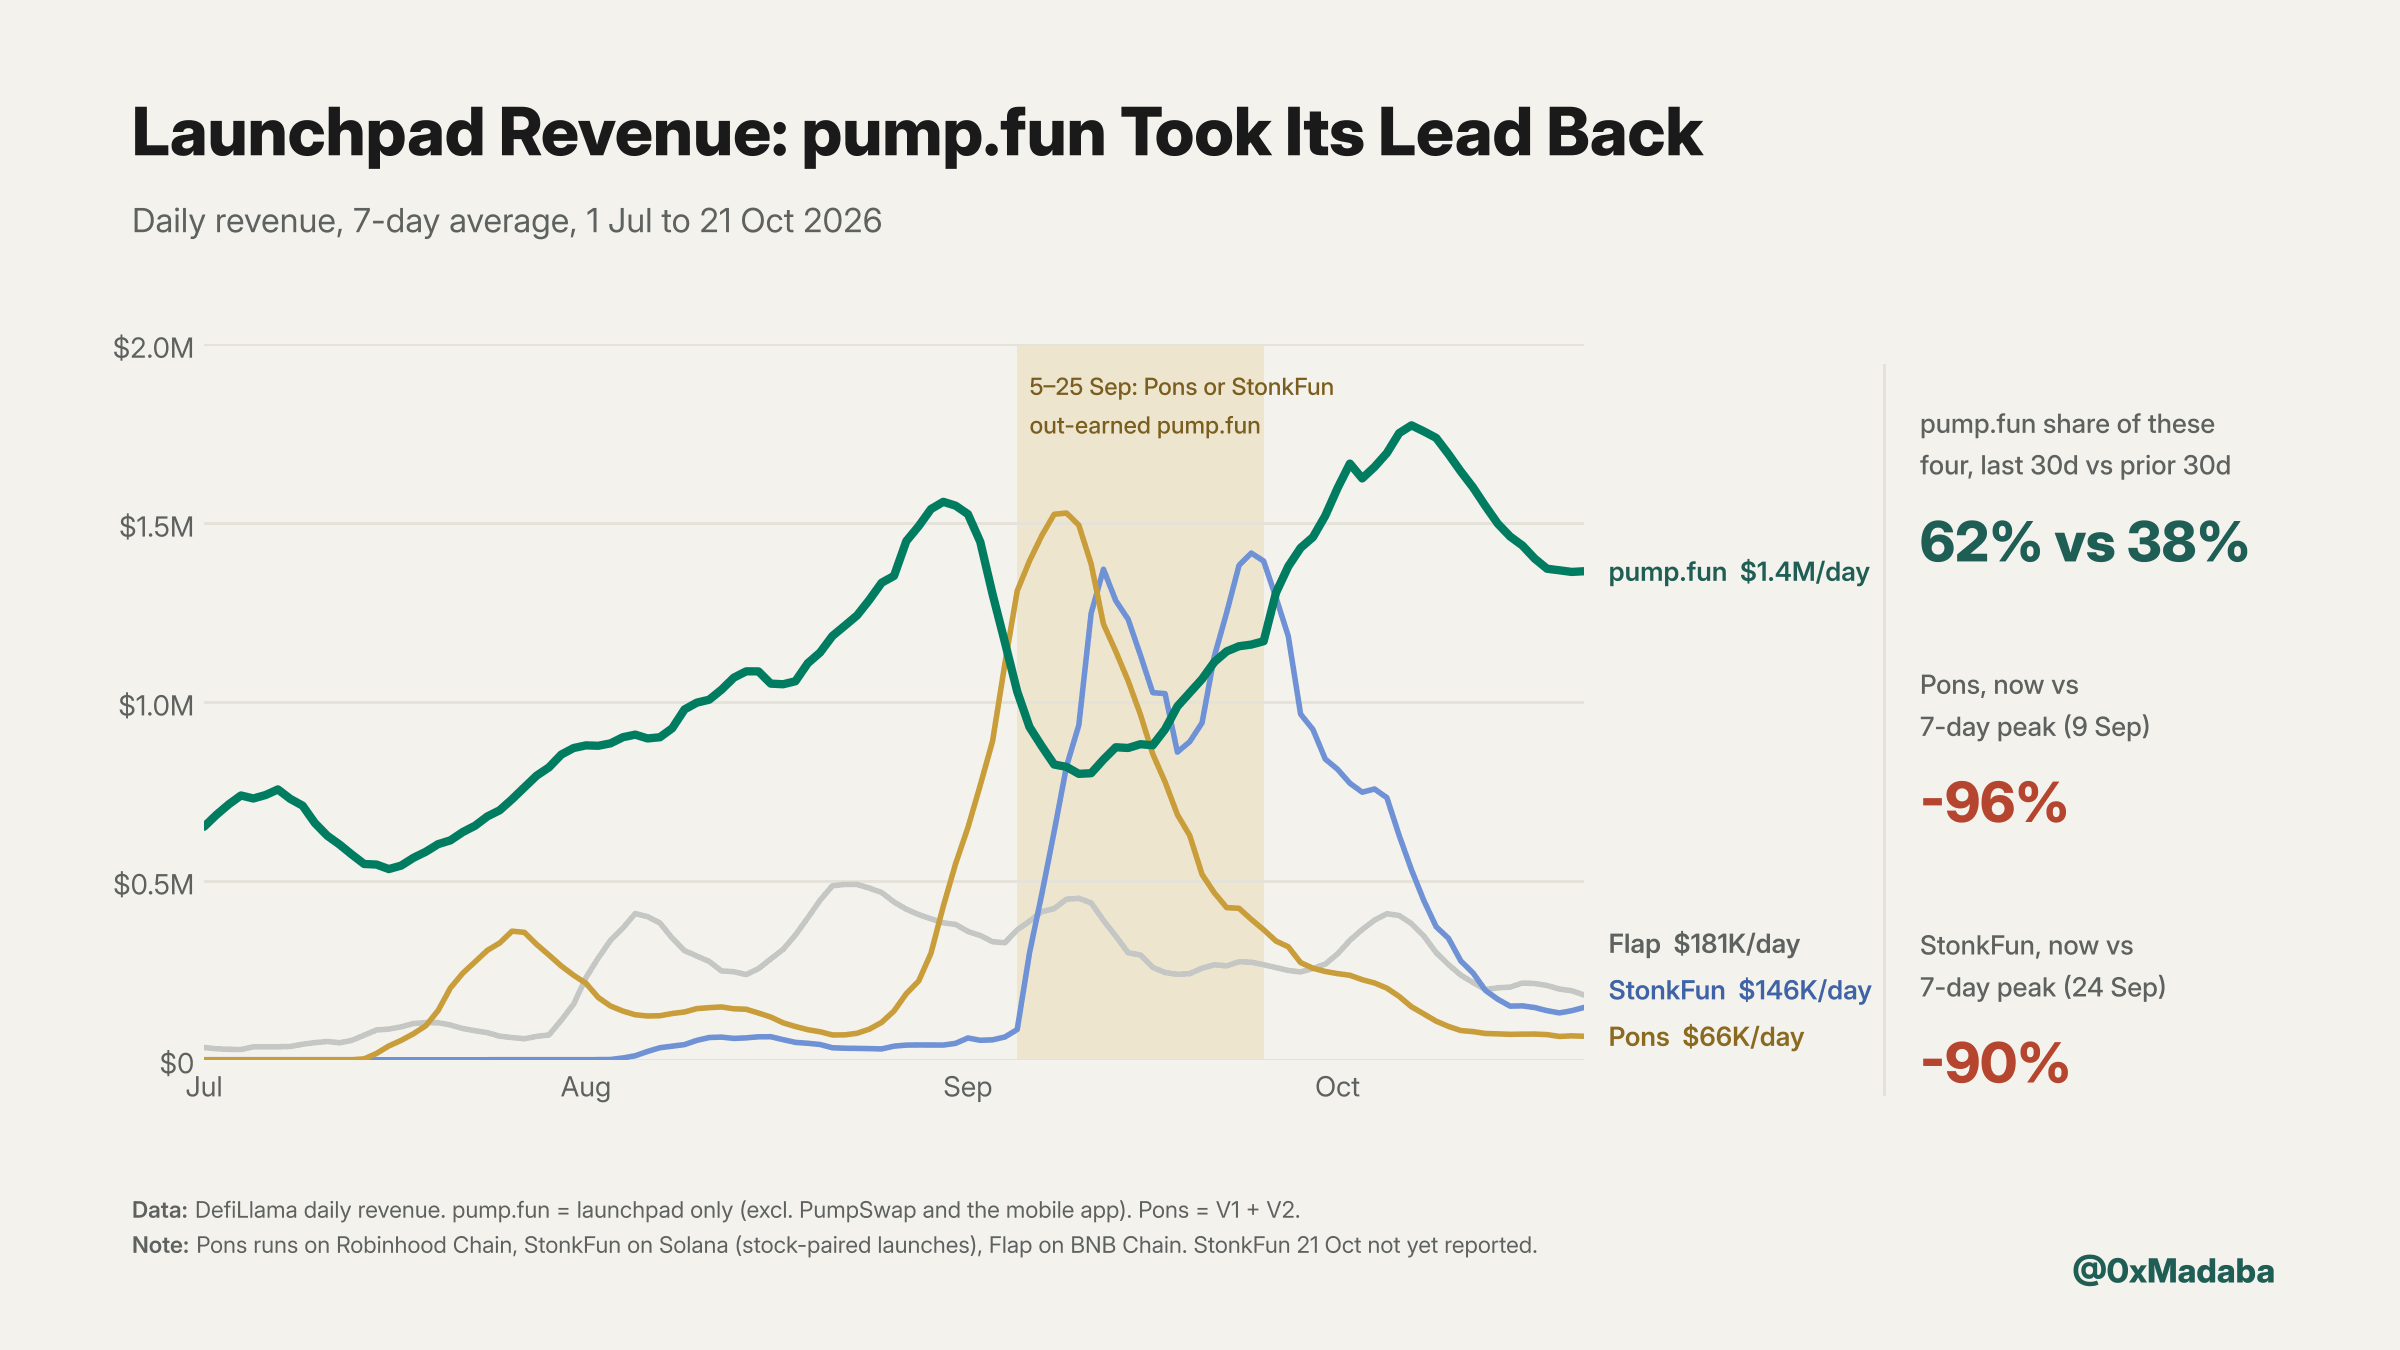
September's narratives
Robinhood memes and stock-paired memes pushed Pons and StonkFun past $2M in daily revenue, repeatedly ahead of Pump's launchpad. Since their peaks, 7-day average revenue fell 96% for PONS, 90% for STONK and 23% for PUMP. Pump's revenue share among the top 4 went from 38% to 62%.
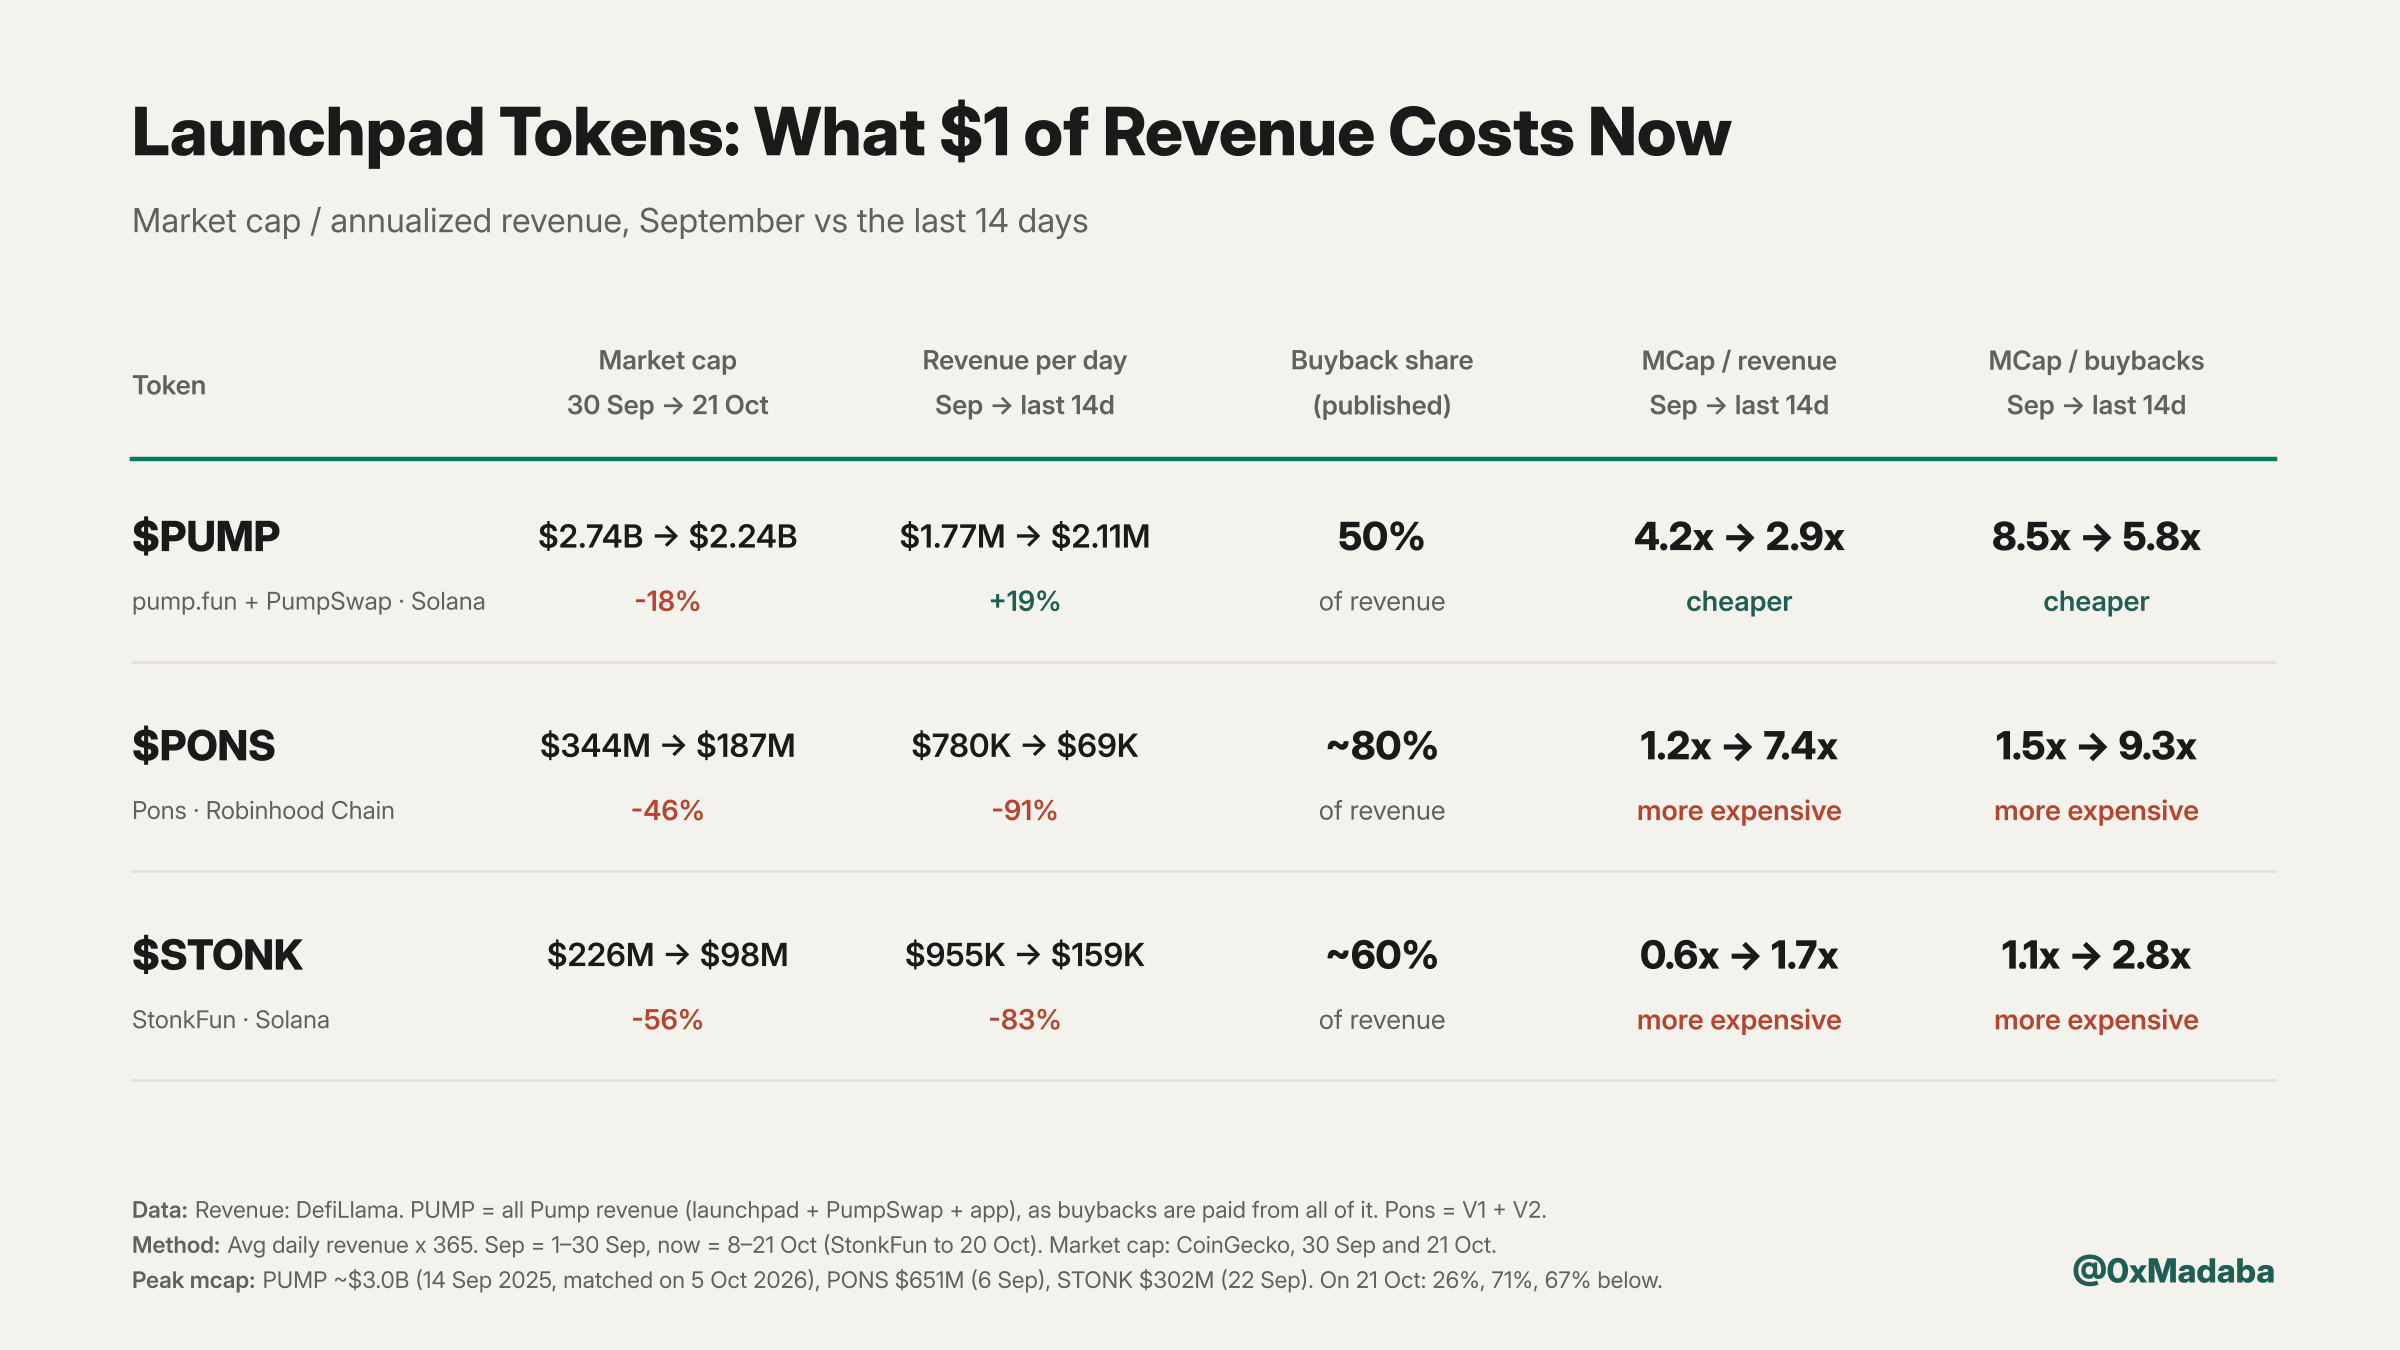
Lower prices, higher multiples
Market cap over annualized revenue, September versus the last 14 days: PUMP 4.2x to 2.9x with revenue up 19%, PONS 1.2x to 7.4x with revenue down 91%, STONK 0.6x to 1.7x with revenue down 83%.
What it shows
Narratives take over fast, and the real question is how much of the activity is sustainable. Pump's revenue now comes from more than token launches, and Pons and StonkFun could become interesting again if onchain activity returns.
The main thesis of this piece is followed in the track record →
Keep reading
Top onchain protocols by revenue multiple: November update
Eleven tokens ranked by market cap over annualized 30-day revenue, from PUMP at 2.7x to LINK at 163.3x, with a median of 14.1x and the biggest revenue movers.
Read more →
USD.AI: A real lending business. But does $CHIP get any of it?
USD.AI's loan book went from $3M to $311M this year with ~$35-40M in annualized fees. CHIP holders get $0 of it, so far.
Read more →