Robinhood Chain revenue by app
Which apps and native projects earn the most on Robinhood Chain, and how that changes over time. DefiLlama data, Robinhood Chain share of each app only.
All editions
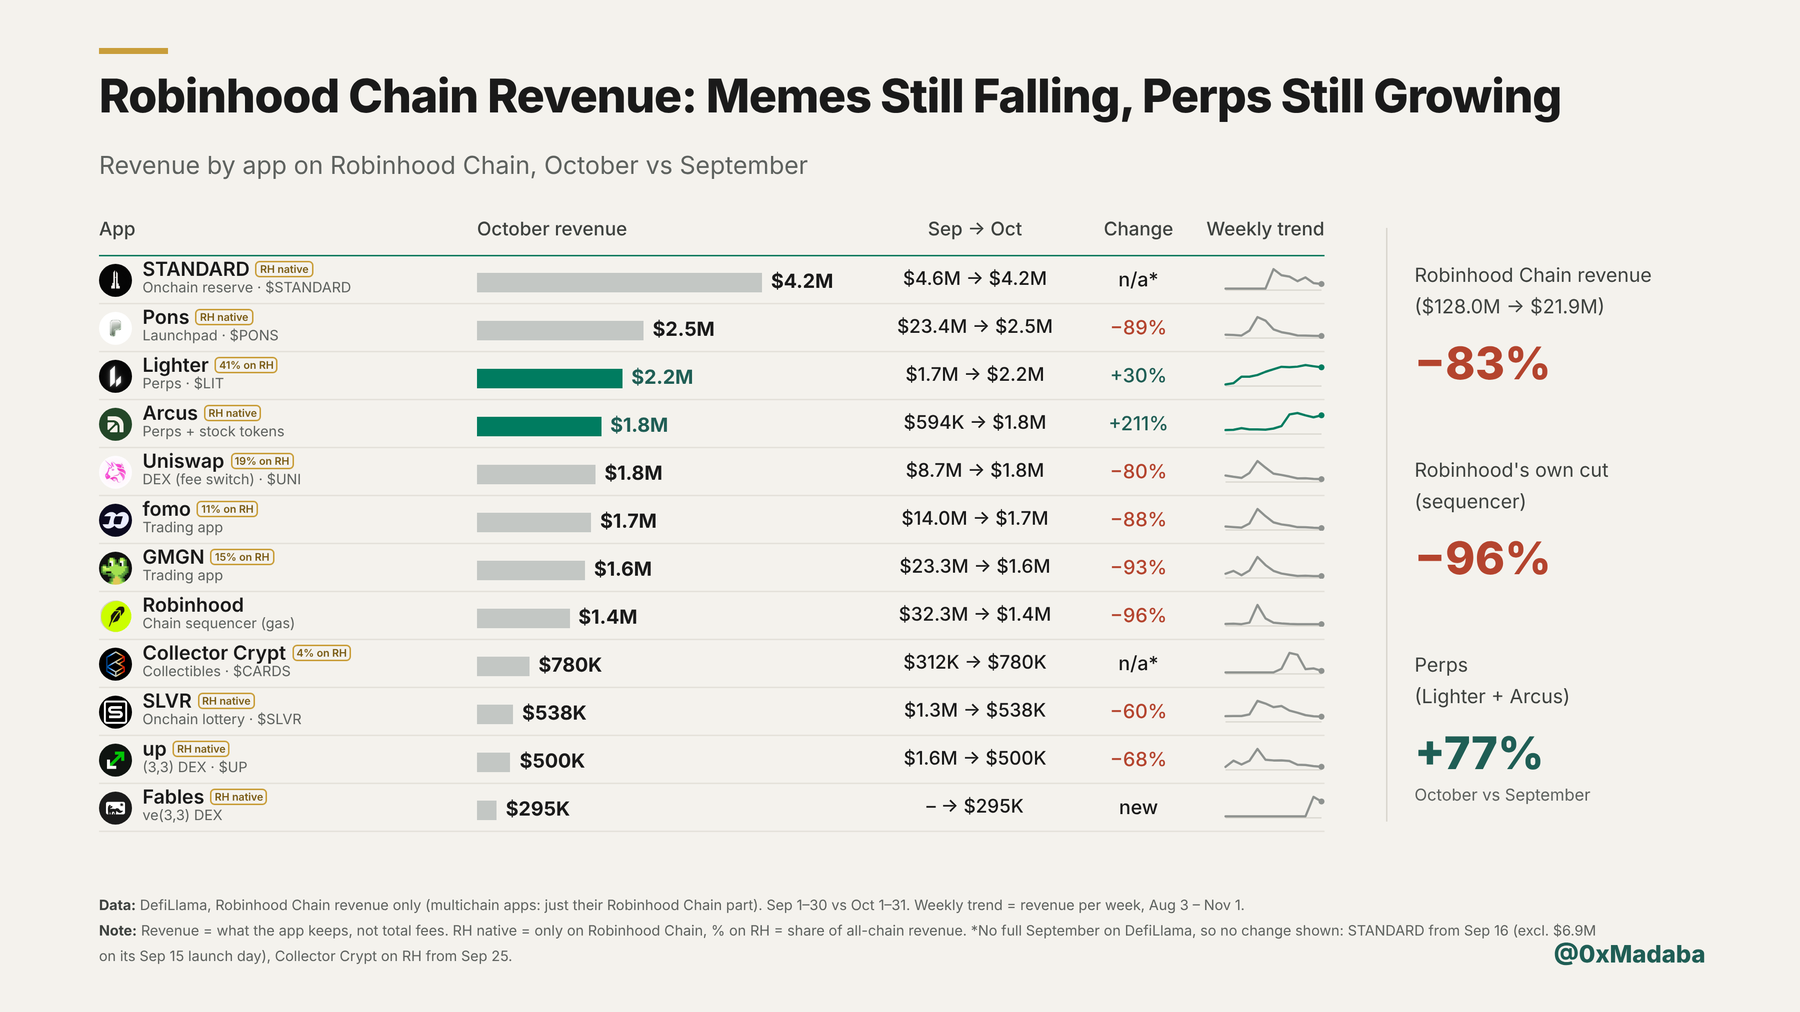
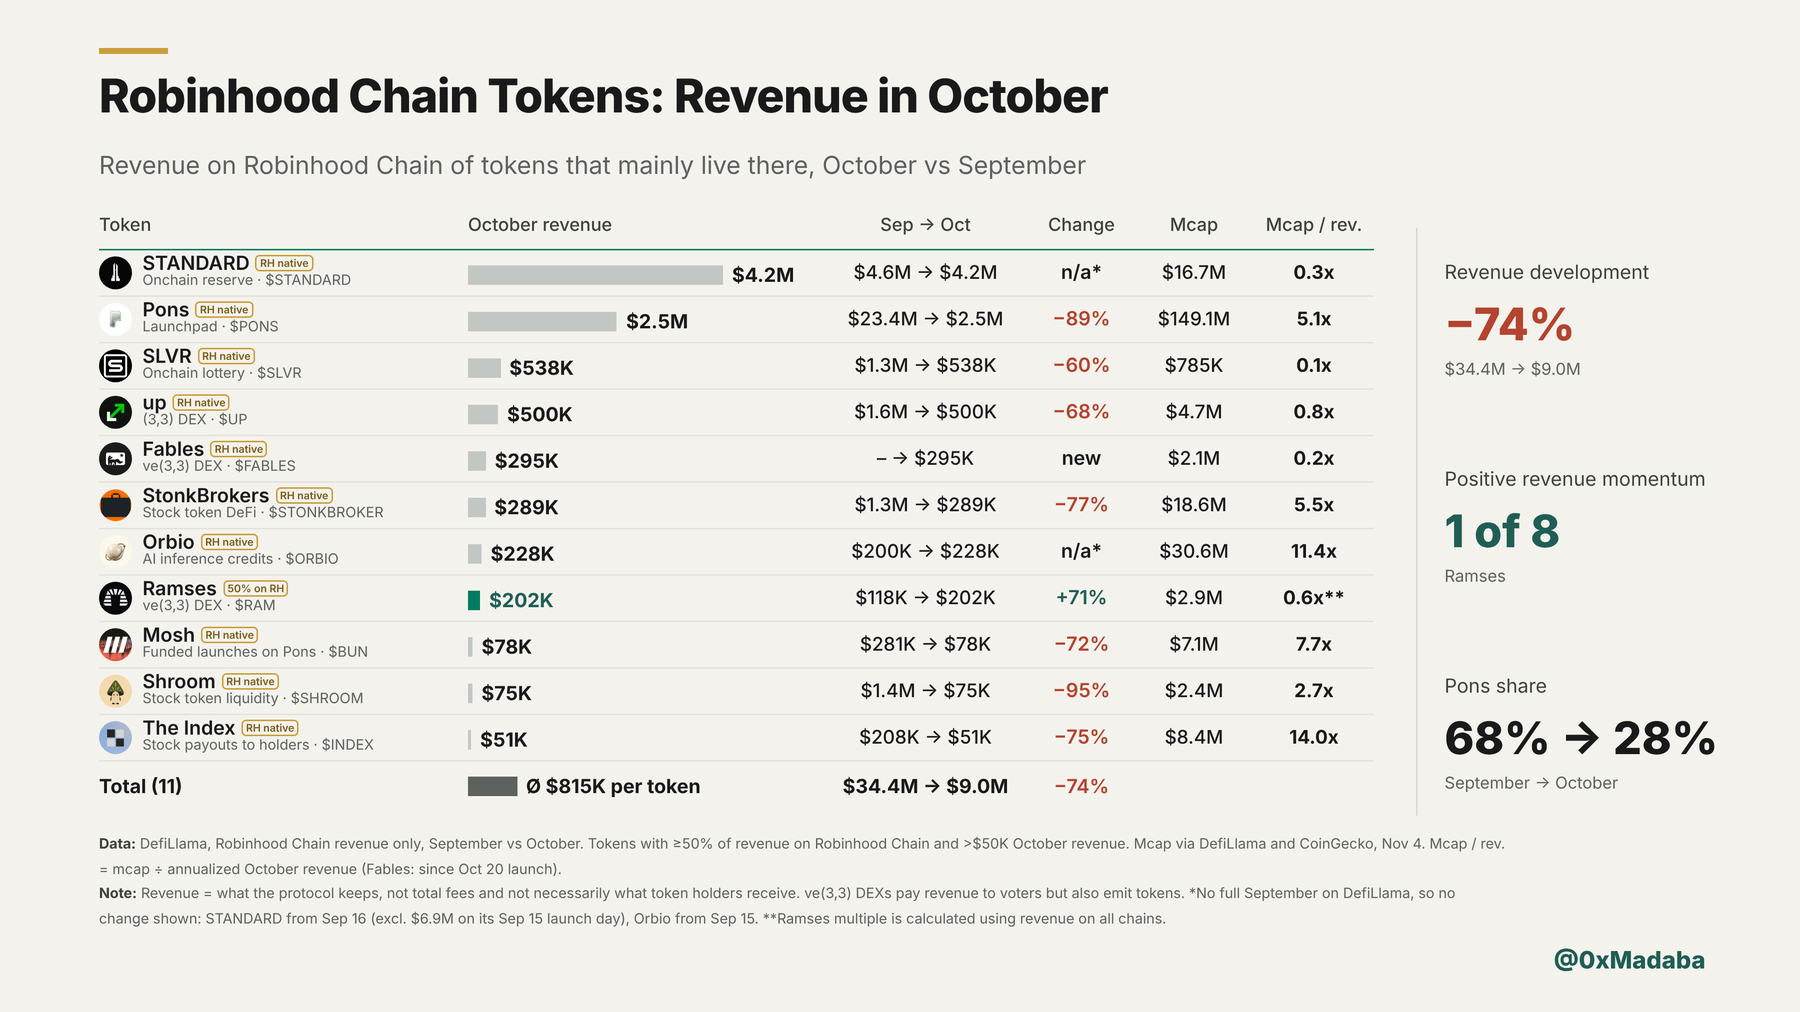
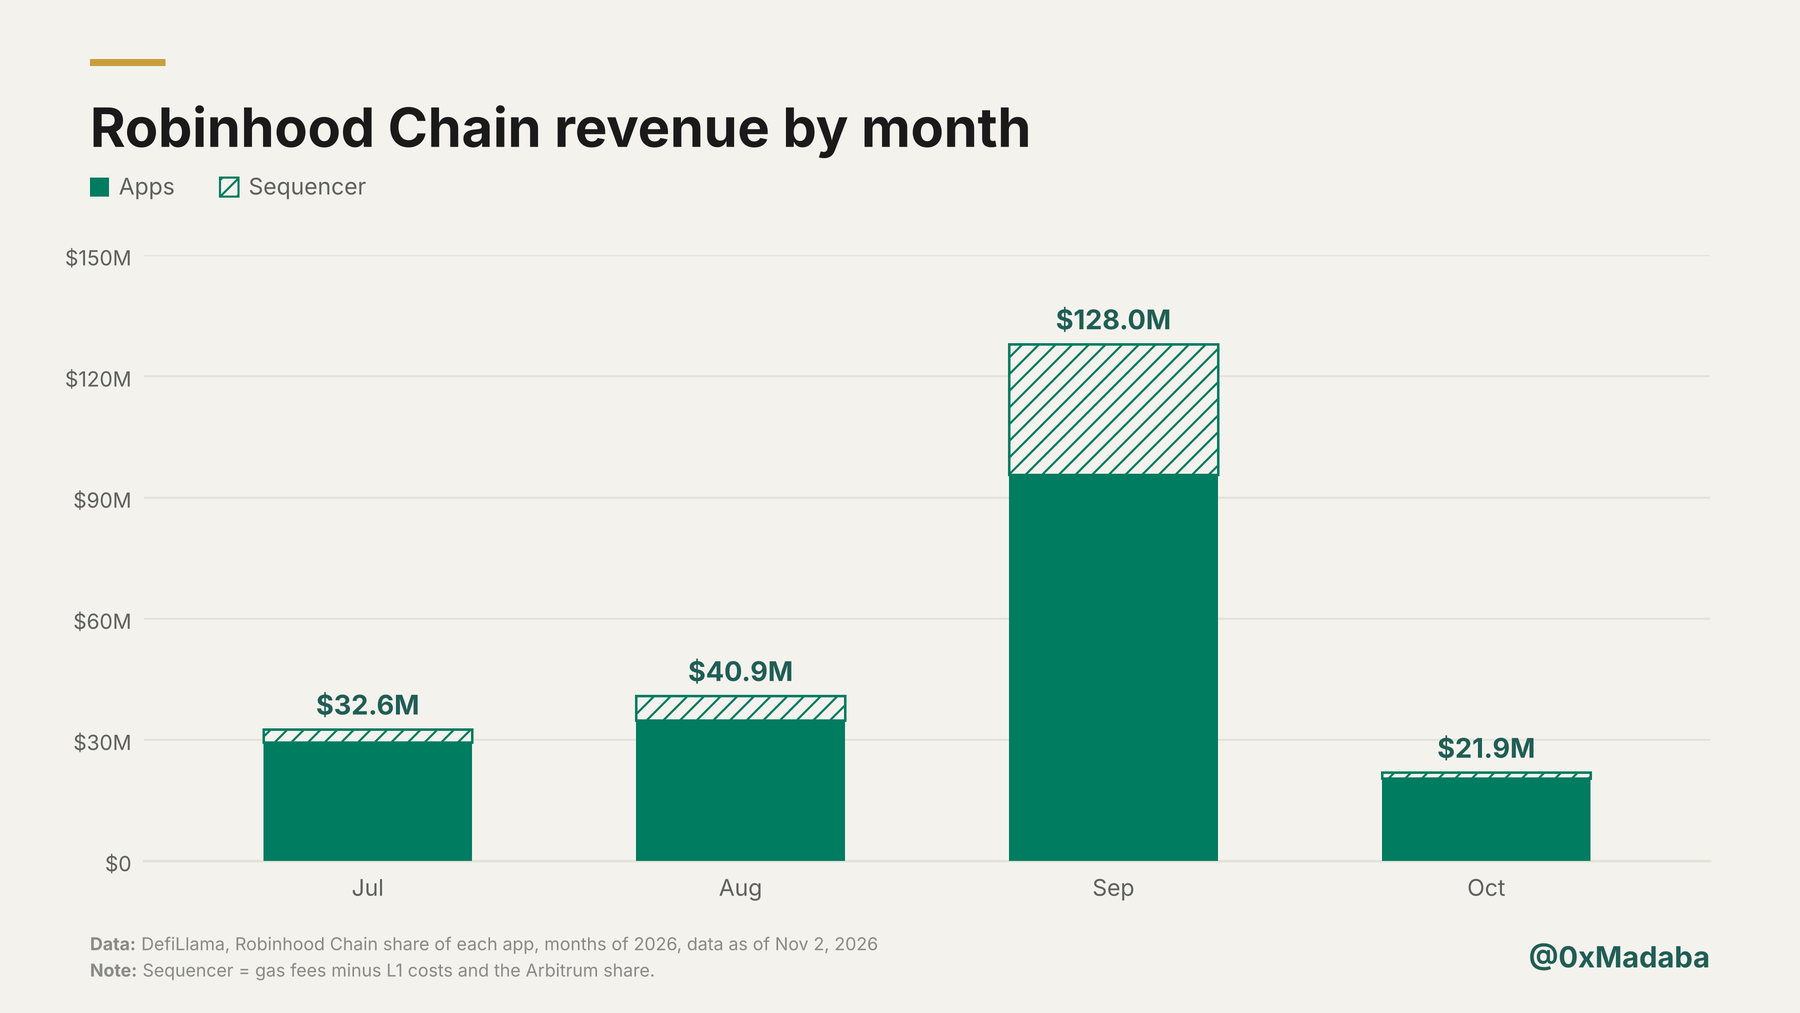
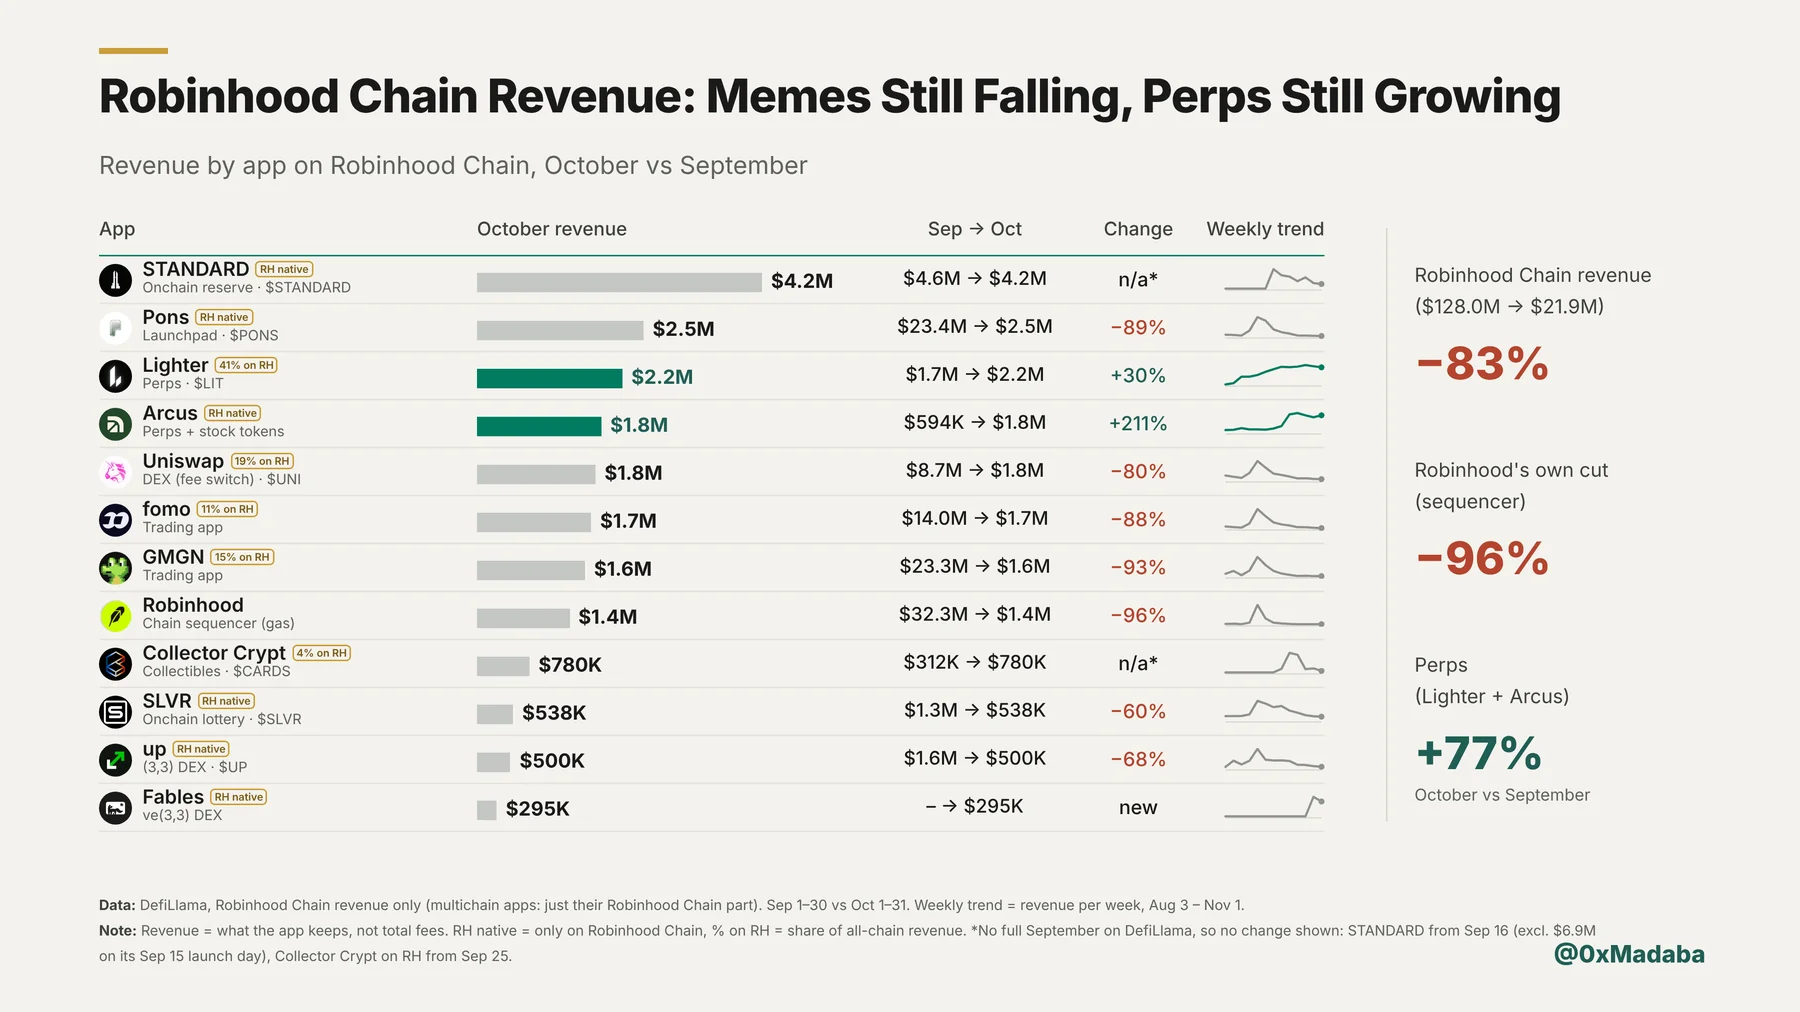
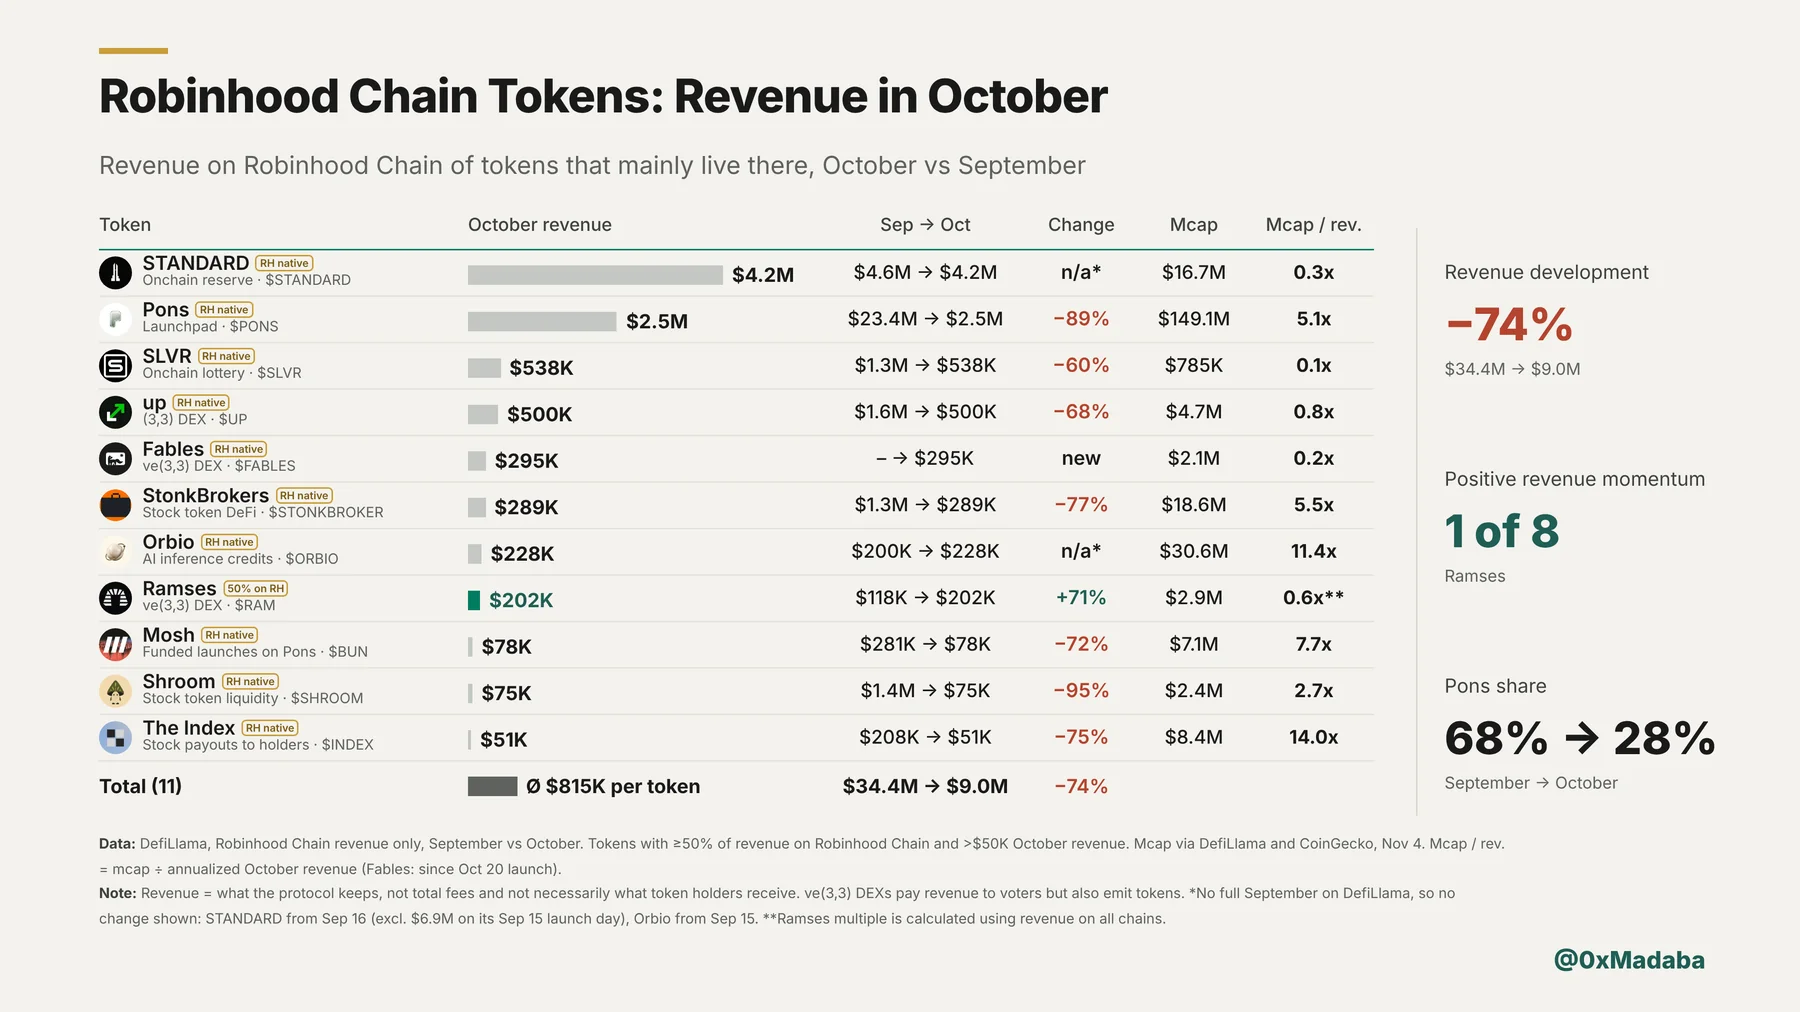
- October vs SeptemberTotal revenue$128.0M → $21.9M−83%Perps share2% → 18%Lighter + ArcusNative projects$34.4M → $9.0M−74%
Meme trading did most of the damage again, with Pons, GMGN and fomo all down roughly 90%. Perps keep growing, and among native projects with a full September only Ramses grew.
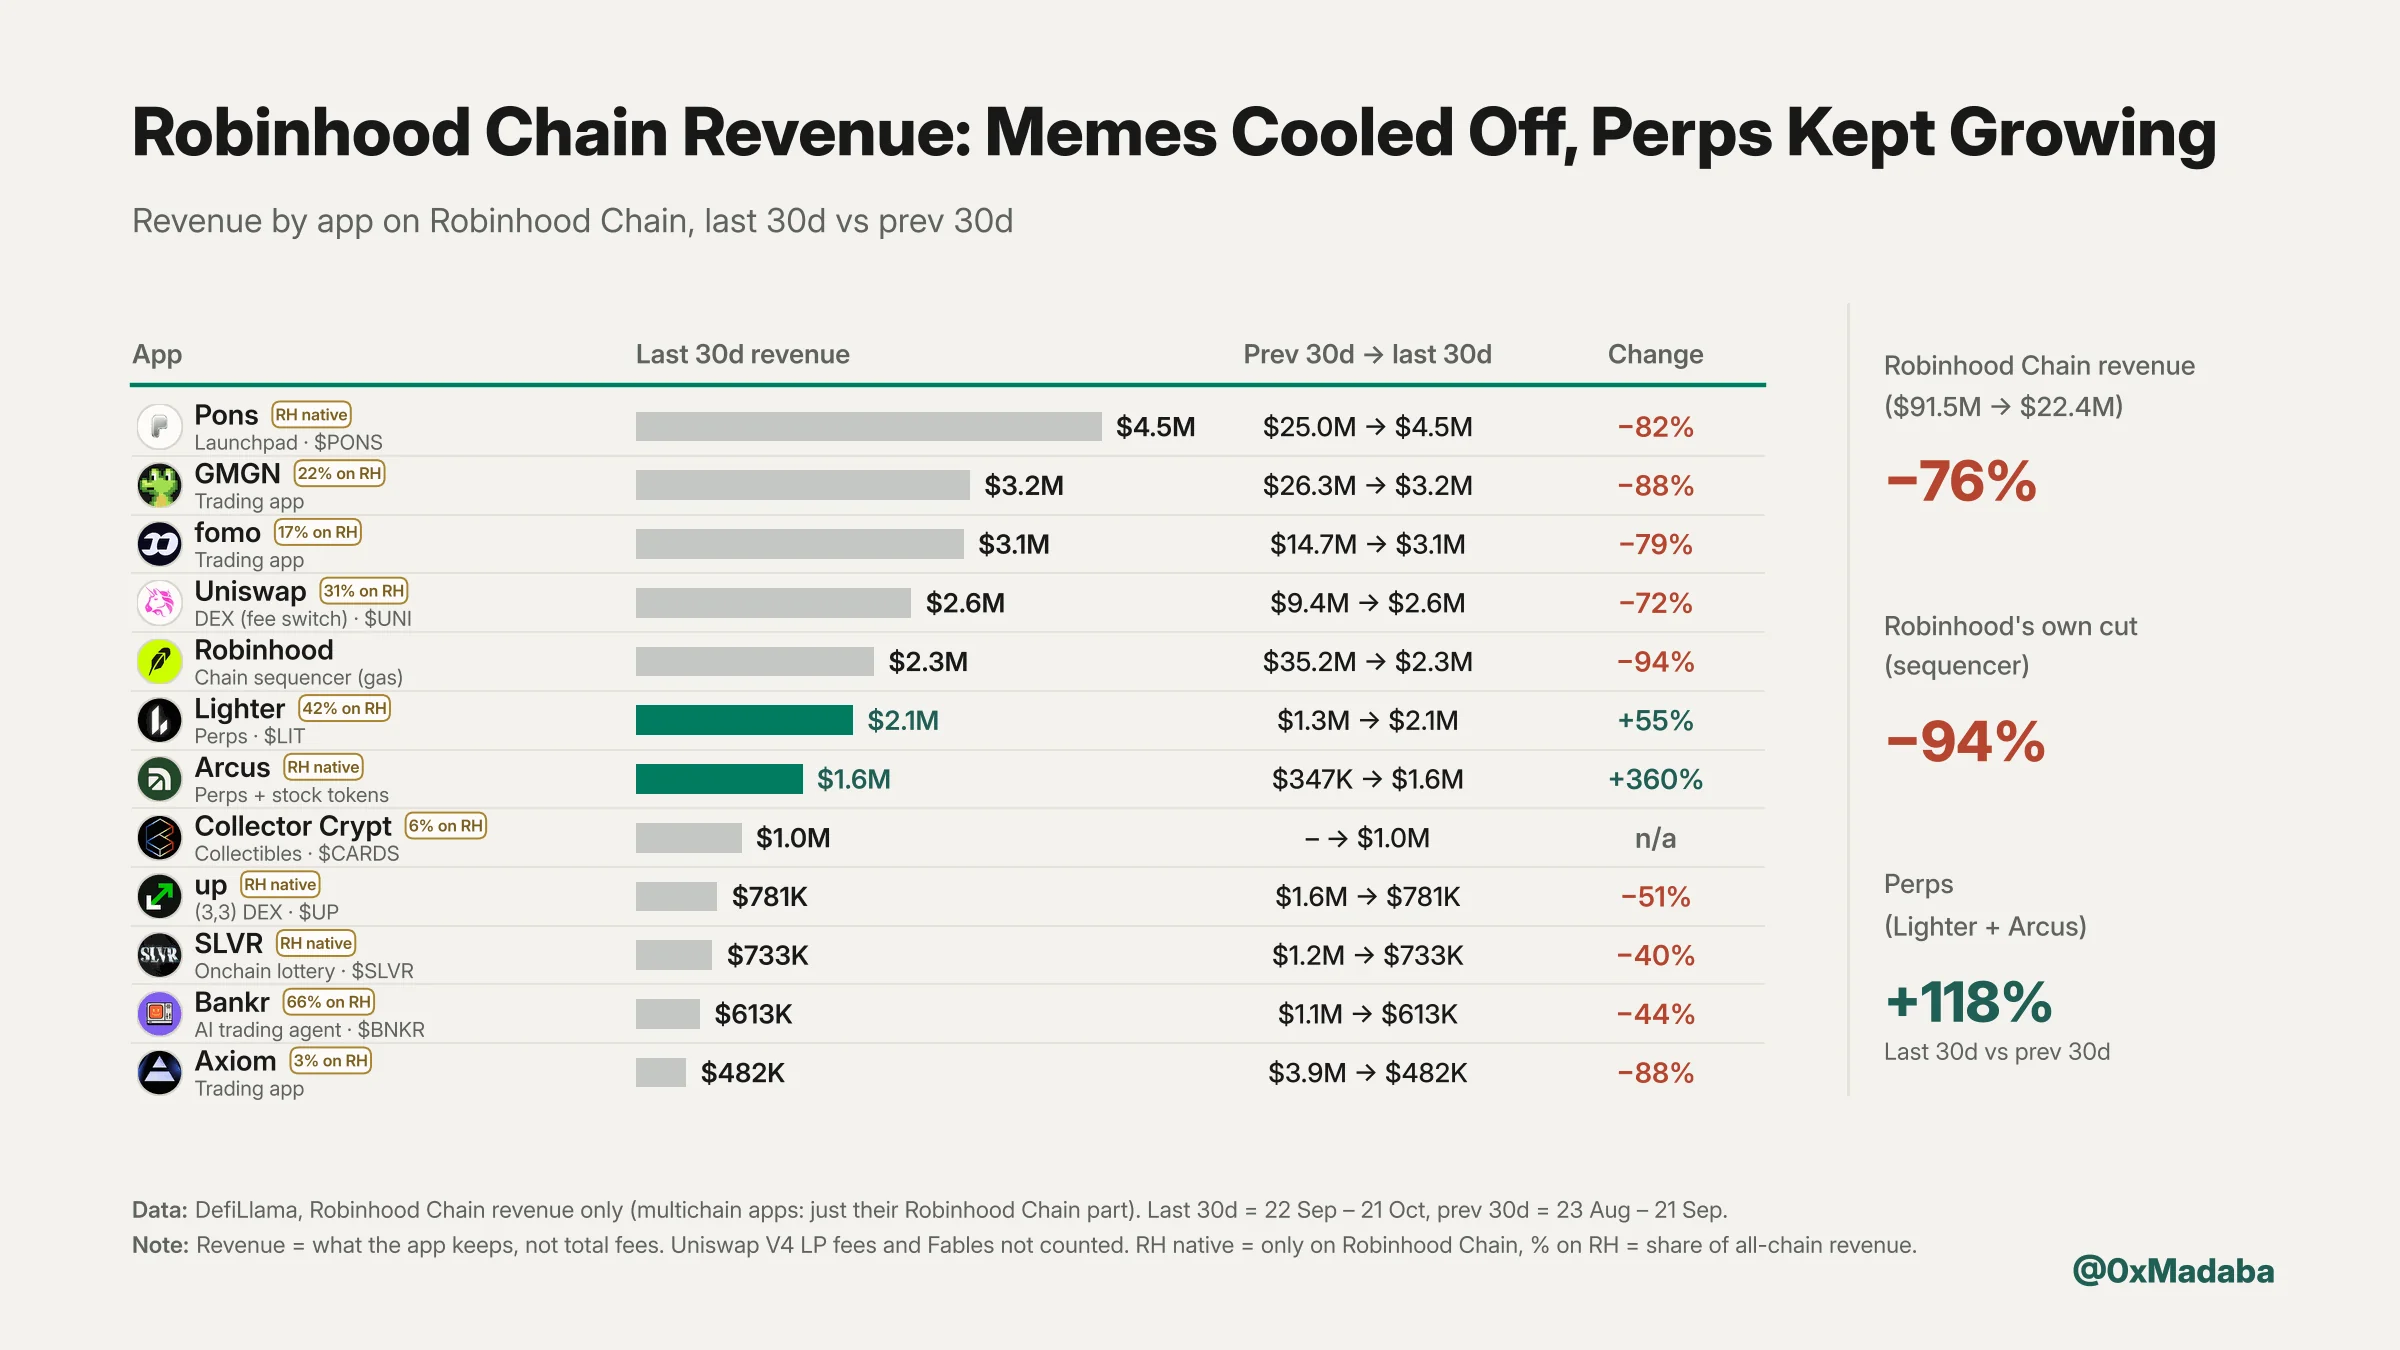
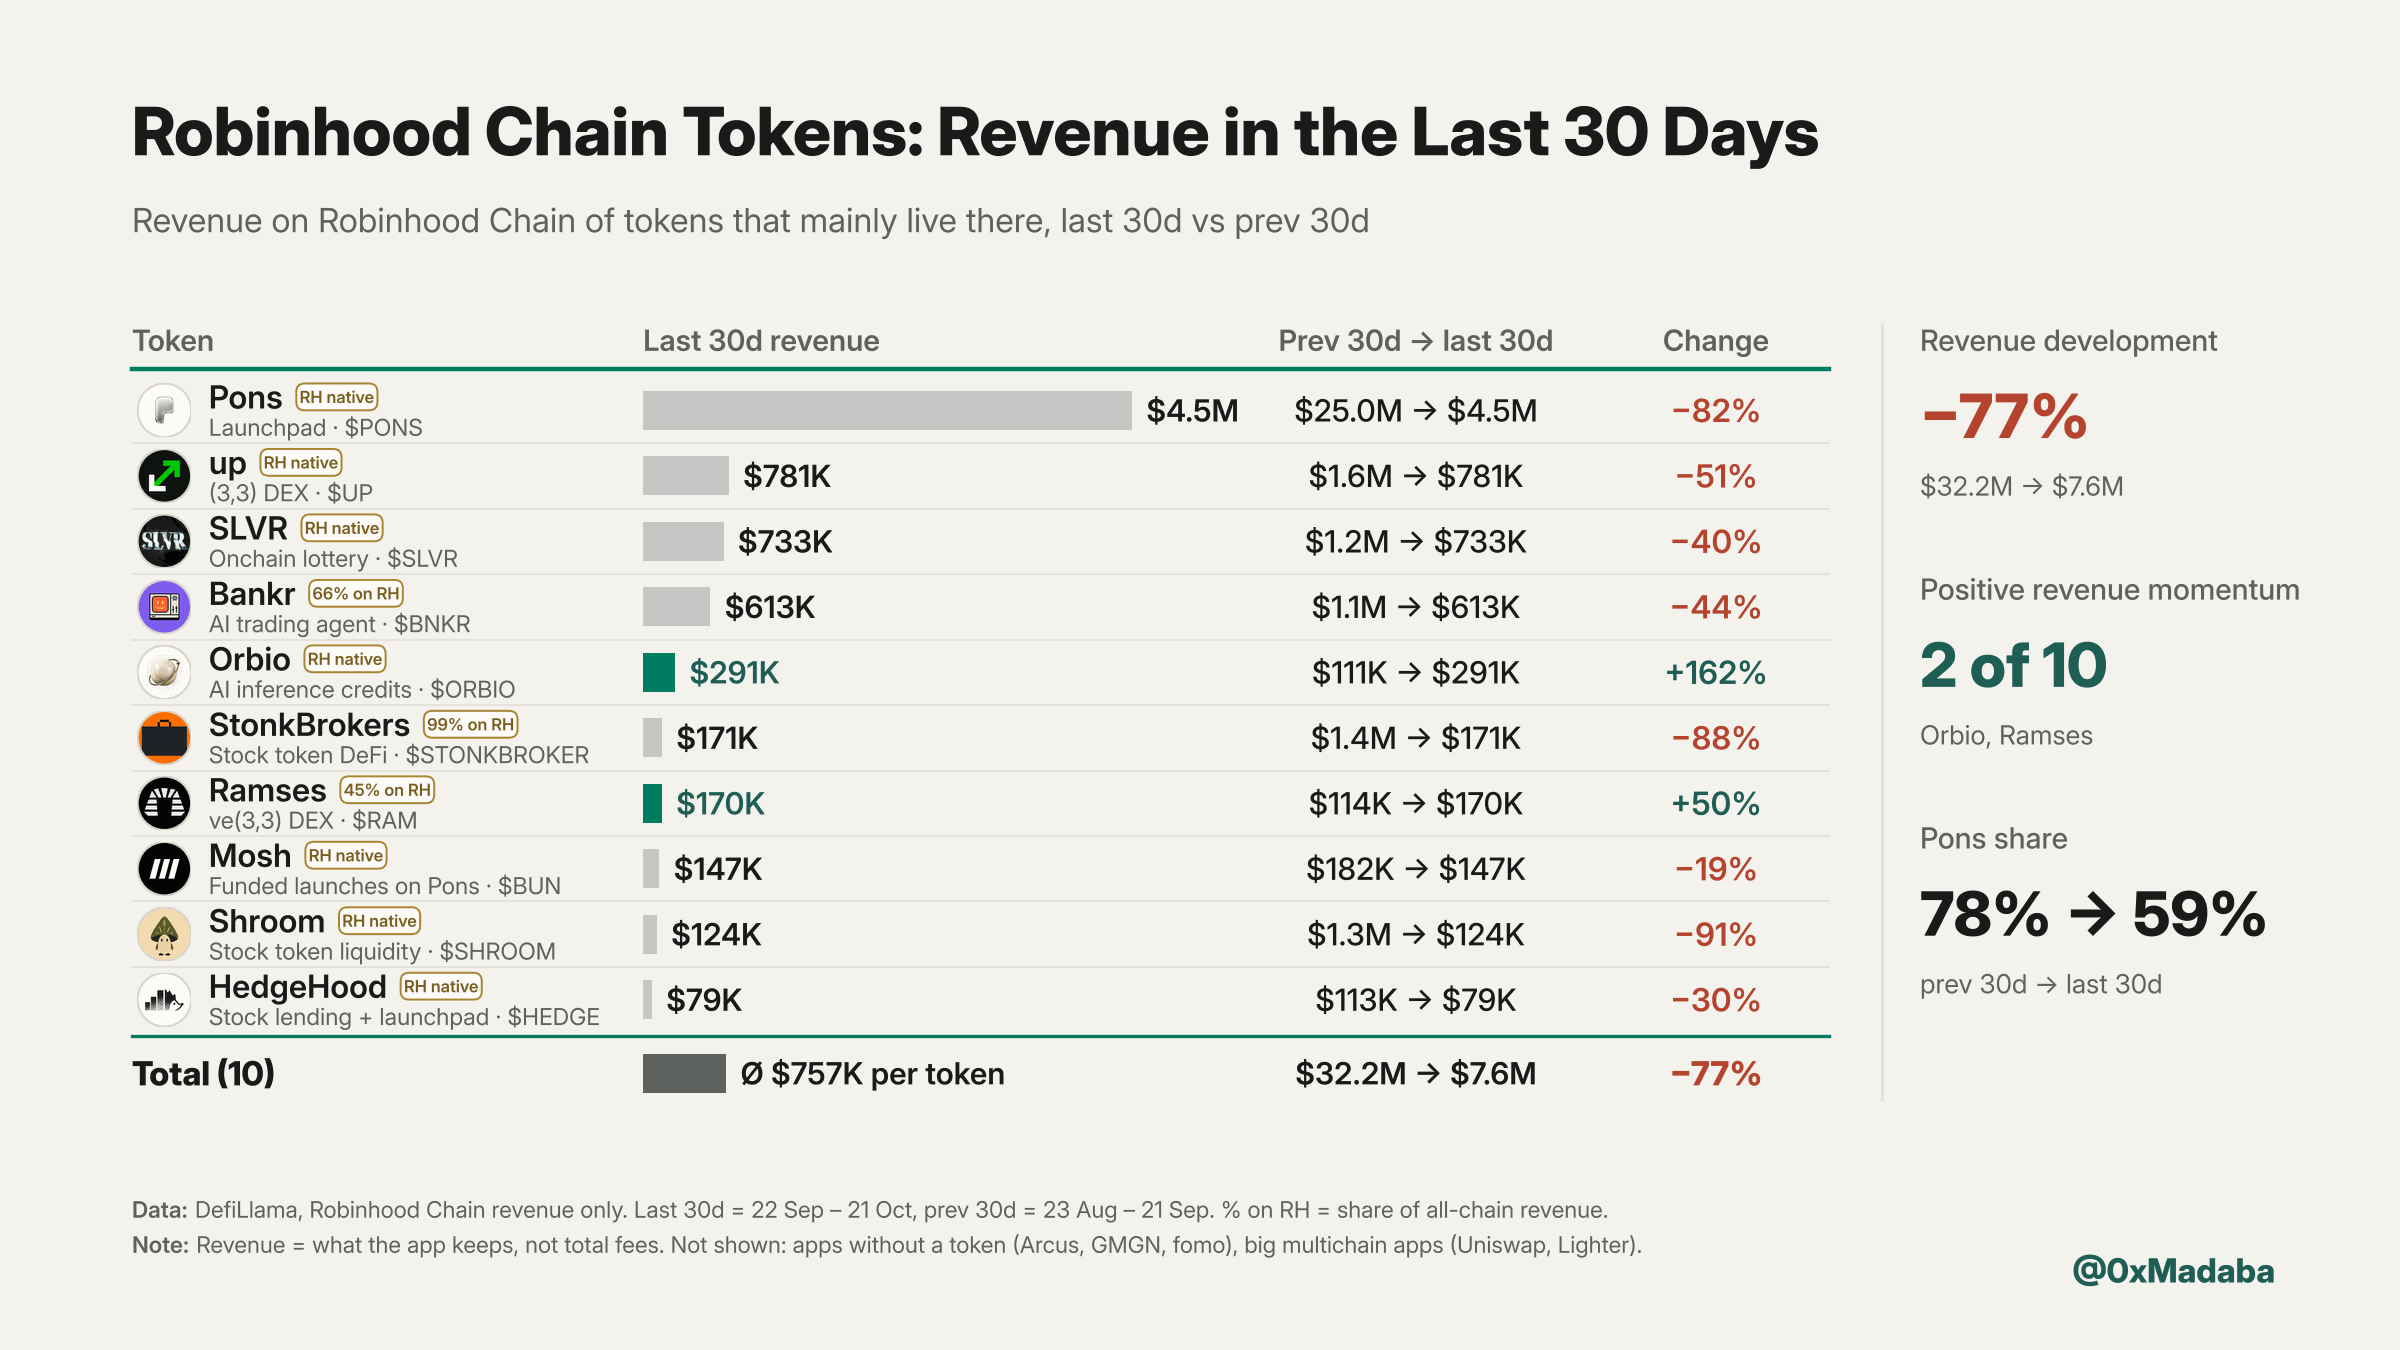
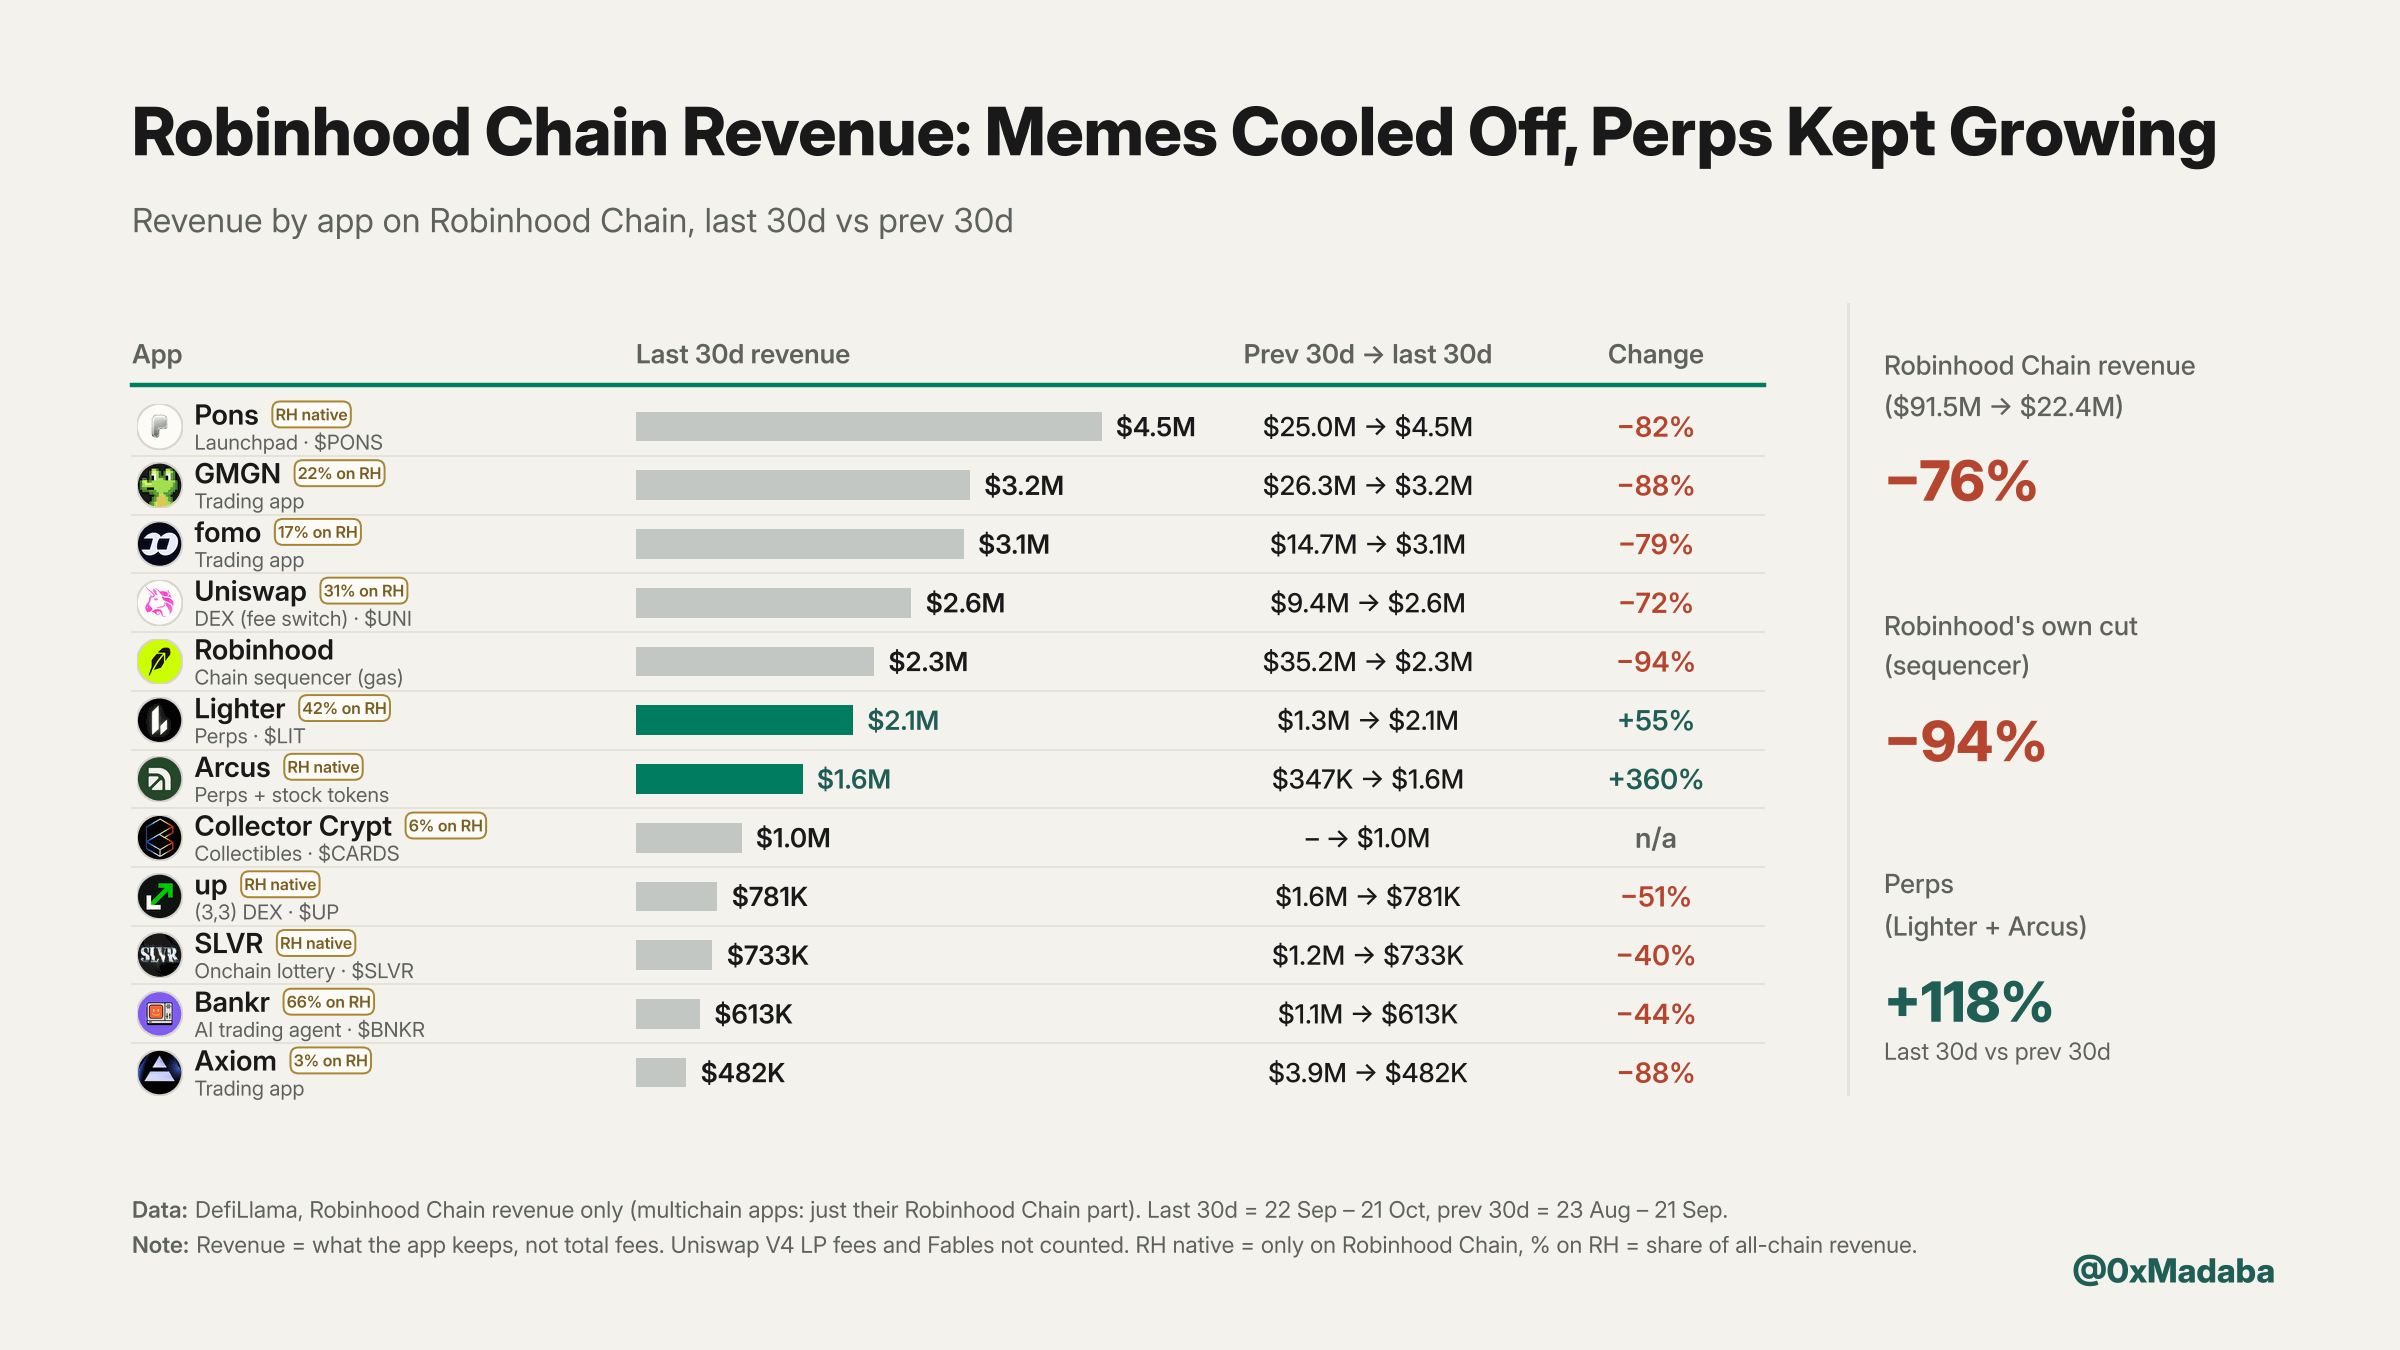
- Last 30 days vs previous 30 daysApp revenue$91.5M → $22.4M−76%Perps share2% → 16%Lighter + ArcusNative projects$32.2M → $7.6M−77%
PONS, GMGN, fomo, Uniswap and Axiom were all down 72-88%, while Lighter and Arcus more than doubled their combined perps revenue.