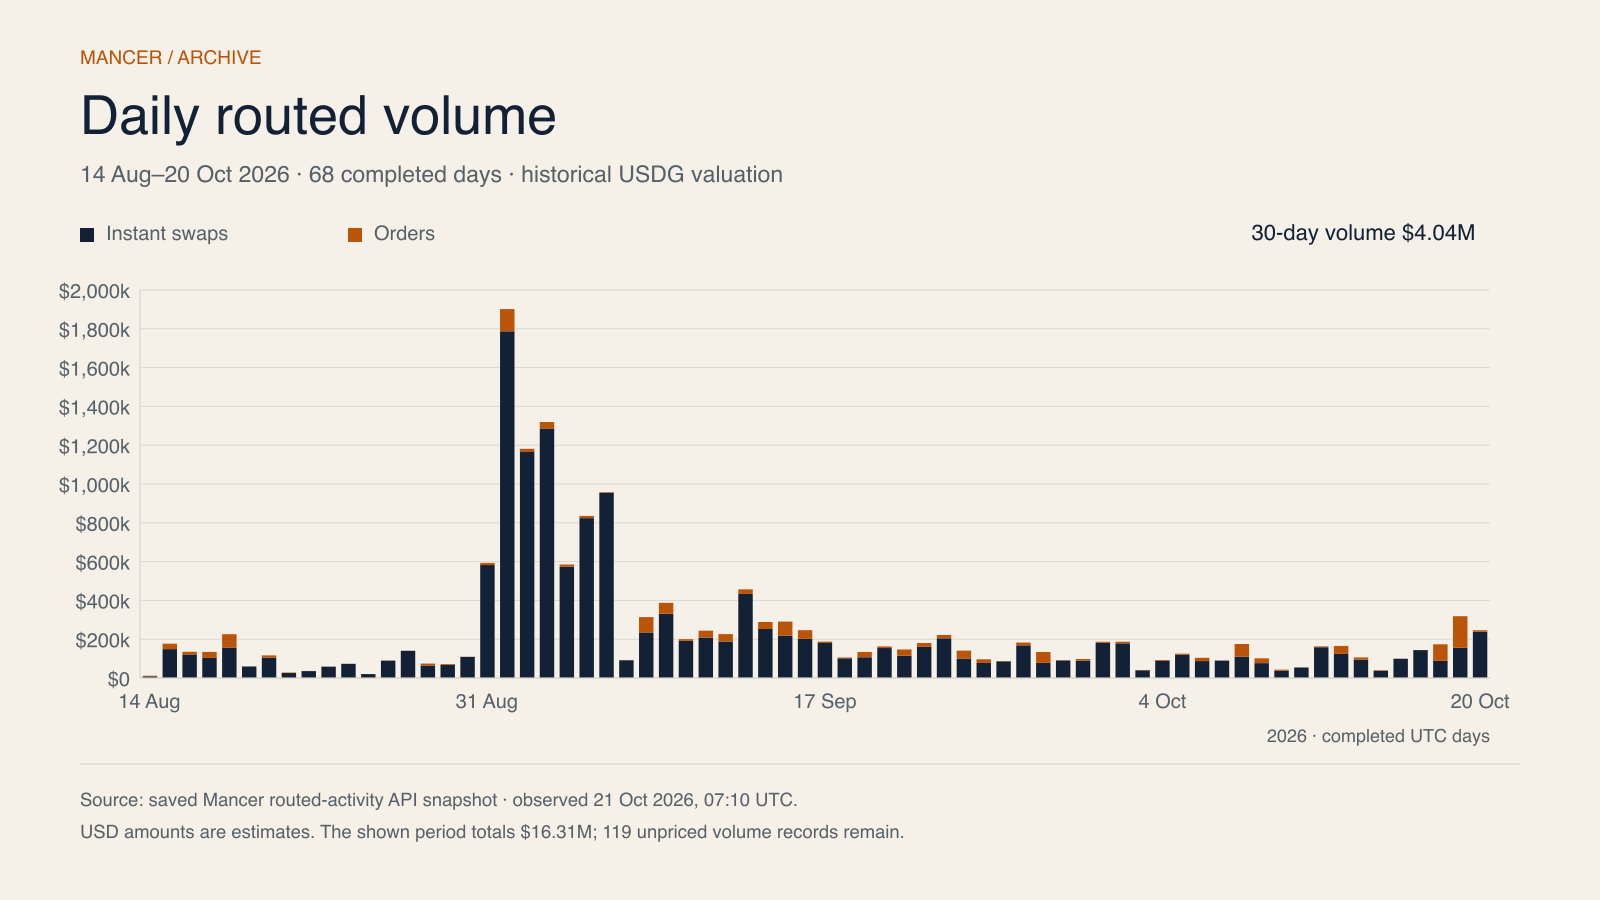
- Routed volume · 30 days
- $4.04M 21 Sep–20 Oct 2026 · estimated USD
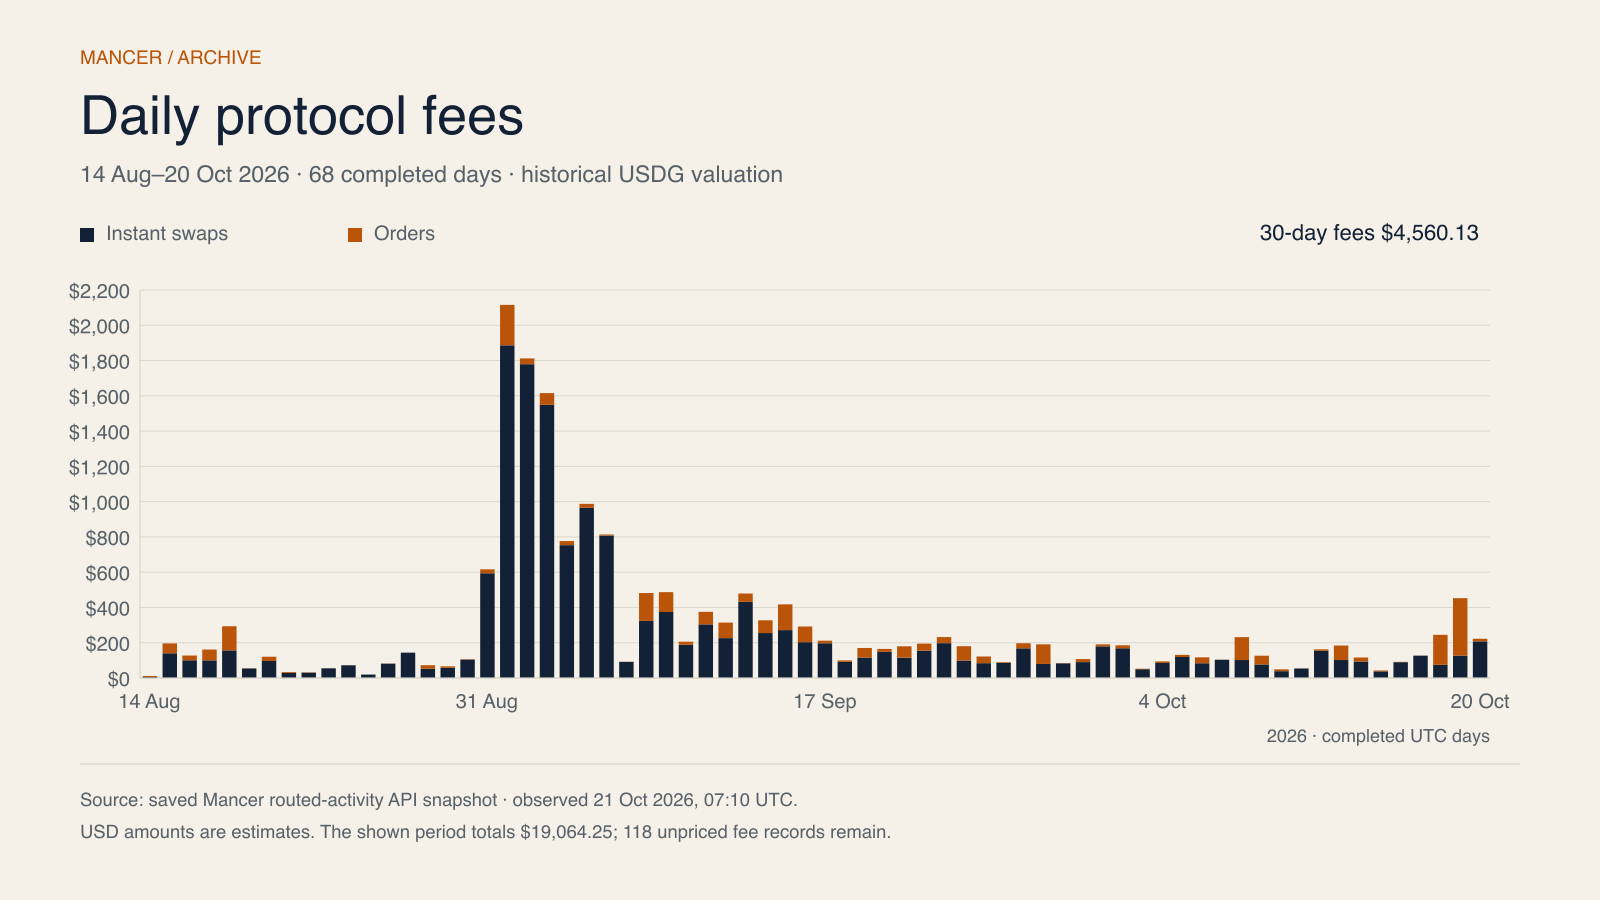
- Protocol fees · 30 days
- $4,560.13 21 Sep–20 Oct 2026 · estimated USD
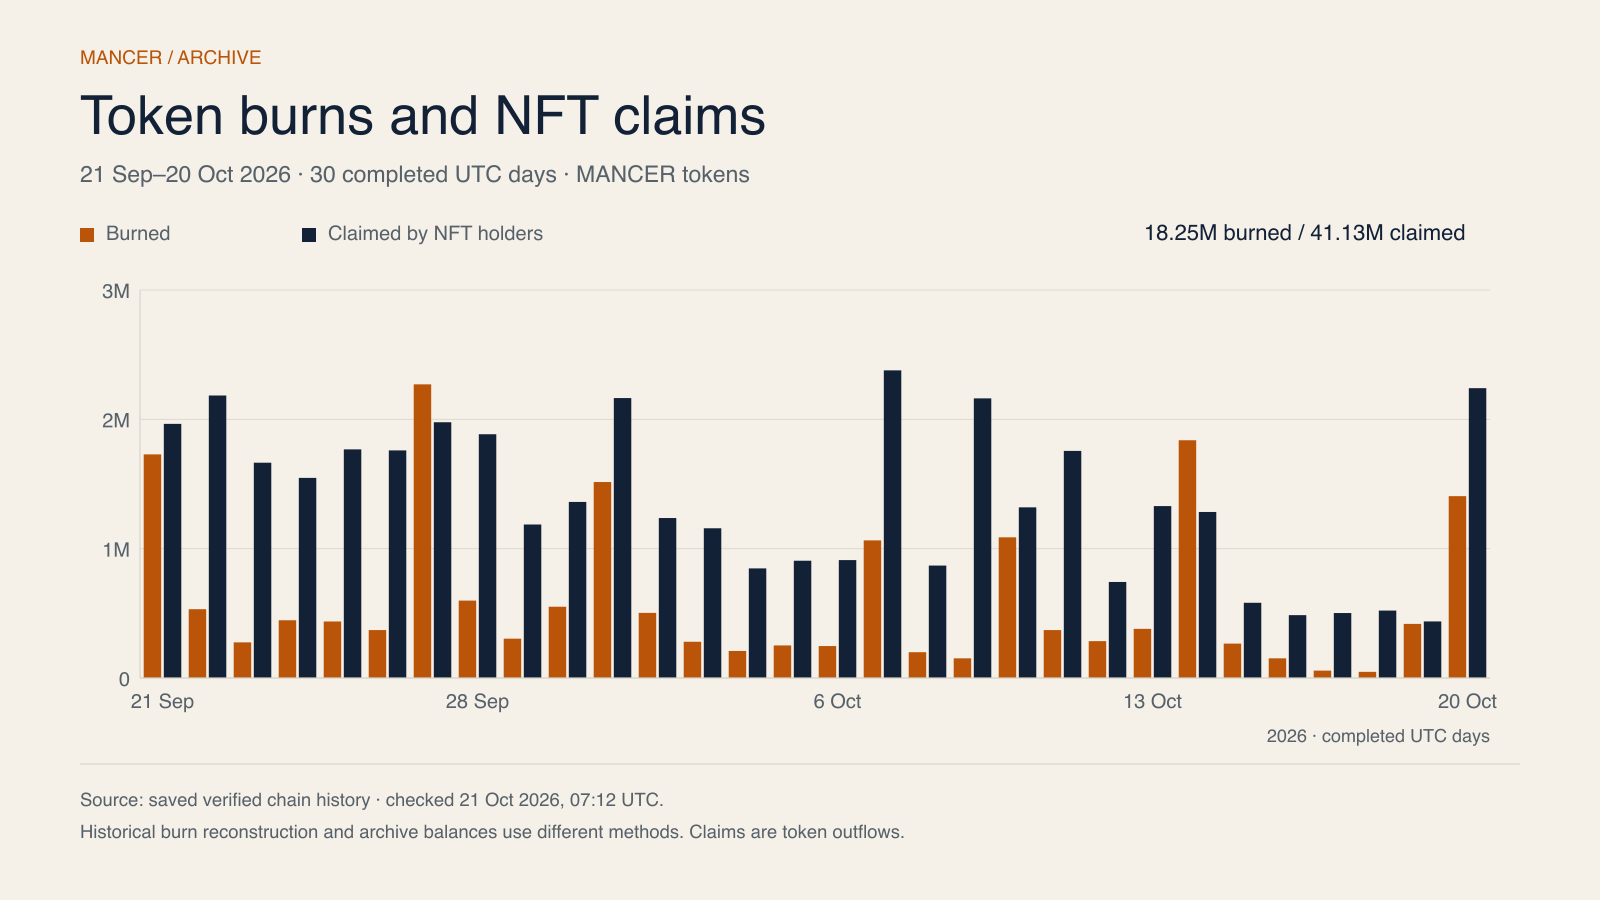
- Tokens burned · 30 days
- 18.25M MANCER · 21 Sep–20 Oct 2026
What the data shows
- Mancer routed an estimated $4.04M over 21 Sep–20 Oct 2026, including $1.13M in the final seven completed days.
- Protocol fees were an estimated $4,560.13 over the same 30 days; the full 14 Aug–20 Oct shown period totals $19,064.25.
- 18.25M MANCER were burned and 41.13M claimed by NFT holders over 21 Sep–20 Oct; burns equaled 44.36% of claimed tokens.
- Burns and NFT claims are separate token flows. Their comparison does not measure profit, net supply change or investor returns.
Sources & methodology
Activity and fee charts use the saved Mancer routed-activity dataset for 14 August–20 October 2026. Dollar amounts use historical USDG valuation and remain estimates. The shown period is not an inception-to-date total.
The source retains 119 unpriced volume records and 118 unpriced fee records. Those records are not converted into invented dollar values. This limitation applies to the displayed estimates.
The token-flow chart uses the saved verified chain history for 21 September–20 October. Historical burn transfer reconstruction and newer archive-balance observations use different methods. NFT claims are token outflows from the staking vault.
This archive preserves the key activity and value-accrual charts. Price, peer-valuation and routing tables with different observation dates are not presented as a common-date snapshot.